
The Quest for Cost Reduction
Analytics is free! It more than pays for itself. All too often we find upper management complain about shrinking bottom line and ask for cost reductions. Sometimes, these familiar complains are associated with pinpointing a particular area in business where they believe costs should be saved. But are we sure we are getting the biggest bang for out buck? Or are we inadvertently making things worse by beating the wrong bushes?
The untapped value of free data
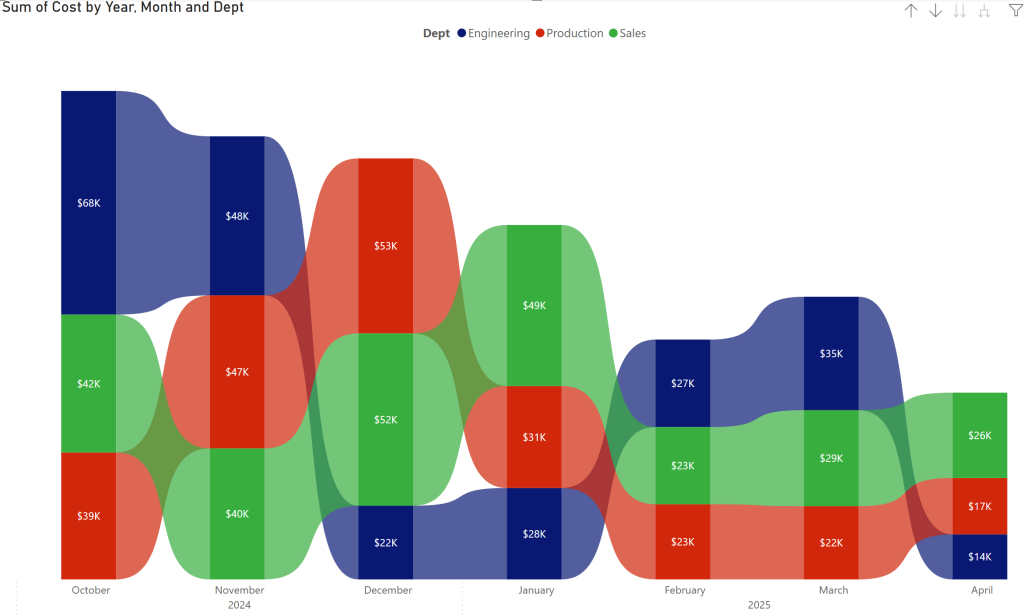
In several instances we looked at the body of existing data that has been accumulating for some time and found huge values in working with them to extract action-oriented intelligence. For example, in a case where defects were chipping away from the hard-earned margines, it was possible to slice-and-dice cost and count of defect incidents to where they occurred along the company’s value stream. As seen in Figure 1, the navy-blue team exhibited notable reduction in the cost of defects compared to the others. This happened to be the team we started with because it produced the highest loss in at the start of the defect-reduction journey.
The Roadmap to the Hidden “Gold Mines” of your Business
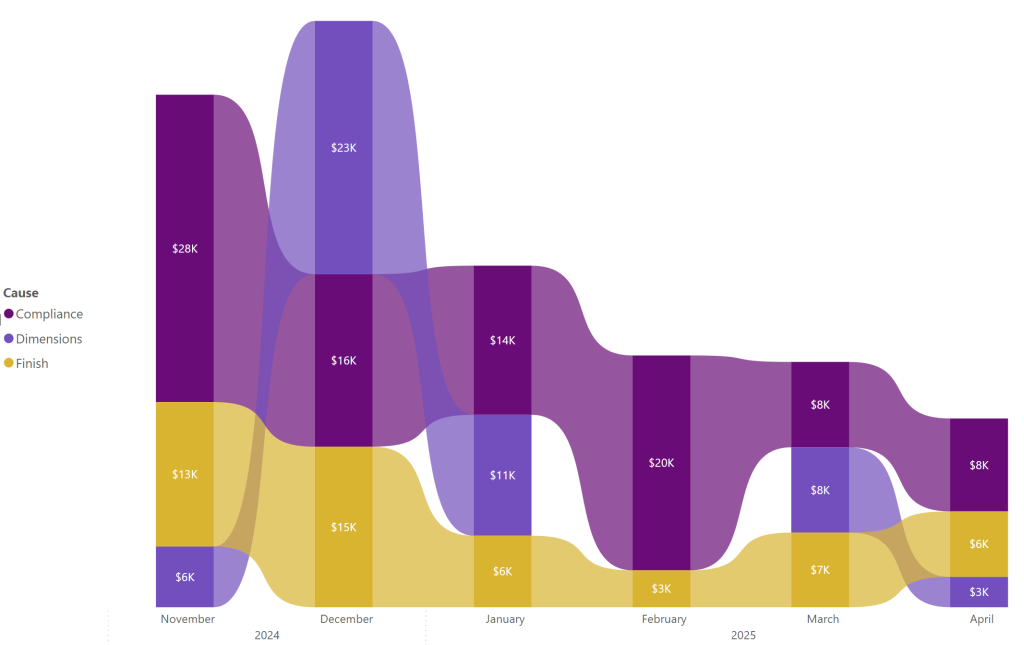
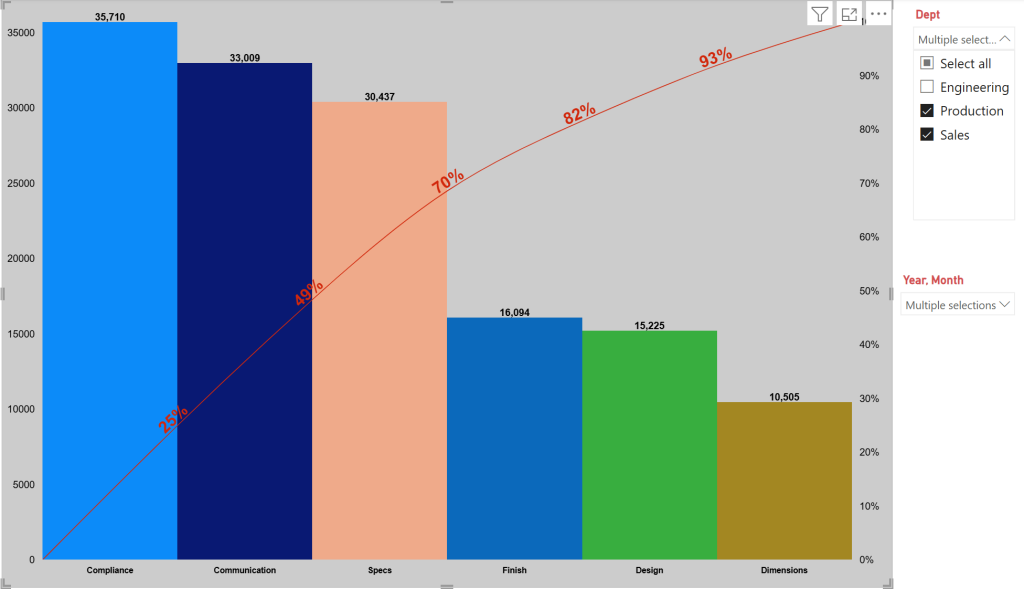
However, to achieve improved results, we drilled down to the causes of each team’s defects and produced another set of ribbon charts such as the example shown in Figure 2. Then a Pareto chart was constructed per team so that priorities could be determined. As illustrated in Figure 3, the top two highest causes are were responsible for 91% of total cost of defects incurred by that team. So, it made perfect sense for us to facilitate rounds of brainstorming workshops to find solutions that resulted in curbing some of the costliest defects. Not only there was reason to celebrate the immediate gains, but the teams were trained and handed in a working methodology to carry on with further improvements (AKA continuous improvement)!
Key Takeaways
- Data collection costs time and money. Exploit existing data, first, and to the fullest.
- Chose a Key Performance Indicator that matters and make sure key stakeholders are on board.
- Define the KPI clearly so that comparable observations can be made over time.
- Let an unbiased individual, skilled in analytics, to work with data and extract intelligence.
- All efforts will be wasted unless that extracted intelligence leads to KPI-evidenced improvements over time.
- Let’s Explore!
F A Q
-
How do analytics work?
Our approach involves four steps: (A) Defining the goal and associated KPIs. (B) Data collection. (C) Data analysis. (D) Interpretation. (E.) Improvement action planning. (F) Action. (G) Improvement verification.
-
Is data collection costly?
We are not going to break your bank! You will be surprised if we told you stories about the abundance of underutilized data that we often find collected and stored somewhere in the records. We are well aware of the cost of data collection and how anxious our clients are in seeing results delivered. So, we make every effort to exploit existing bodies of data and extract maximum intelligence from them.
-
What if there is no data?
If our search for existing data proves unsuccessful, we use scientifically proven sampling plans to draw the required intelligence at high levels of confidence. This is a method we tested and used successfully in several projects. It is critical that the sampling plans are devised professionally, to prevent invalid and misleading conclusions. We are trained to do this and save precious data collection time and cost.