
When we hear the word “productivity” we give it our undivided attention. It should be the same for you as it is often the primary driver for importing business’ bottom-line. This is of course to be taken with a grain of salt! There are unlimited ways productivity could be measured. Finding the right metric or indicator requires a combination of experience and patient reflection. Afterall, you want to push the right buttons that drives your profitability in an effective and efficient way, rather than shooting in all directions, with fingers crossed! By “effective”, we mean what you measure matters. By “efficient”, we mean moving fast in the right direction.
Here are a few illustrations of how we created live dashboards to measure and monitor productivity development over time.
Productivity by Product Category
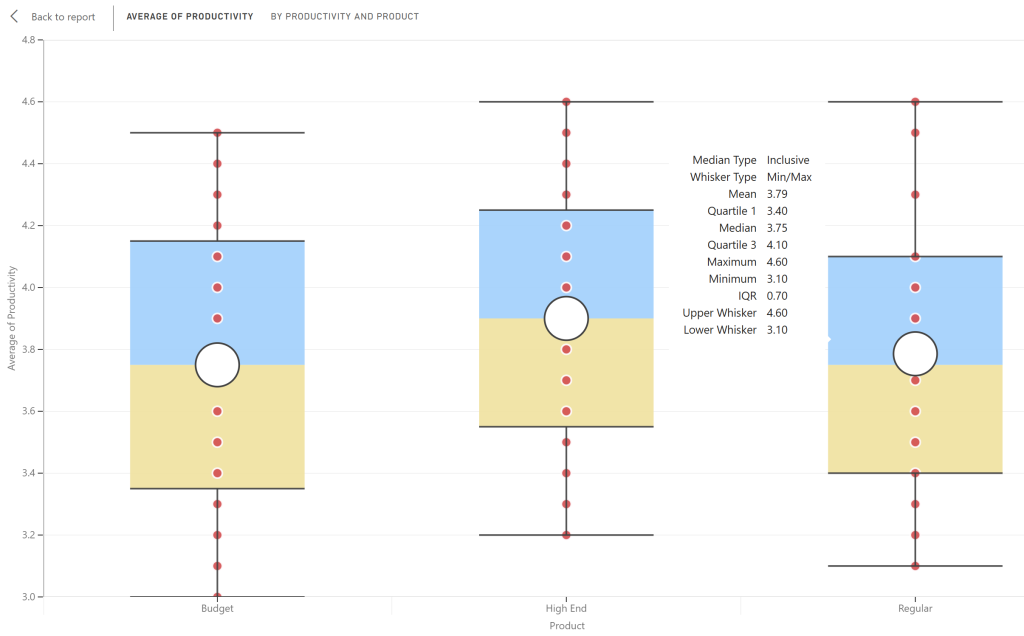
Not all products are created equal. Some contribute to your bottom line more while the others poorly or even barely. Boxplots are great visual tools for side-by-side comparison of how each product category performs on a meaningful scale. Commonsense suggests that we should promote and push high performing product more than the alternative. While this is true, you may still want to carry on with a less productive product for any number of strategic reasons. At least you know the cost of such decisions to weigh against the benefits.
Productivity by Team Member
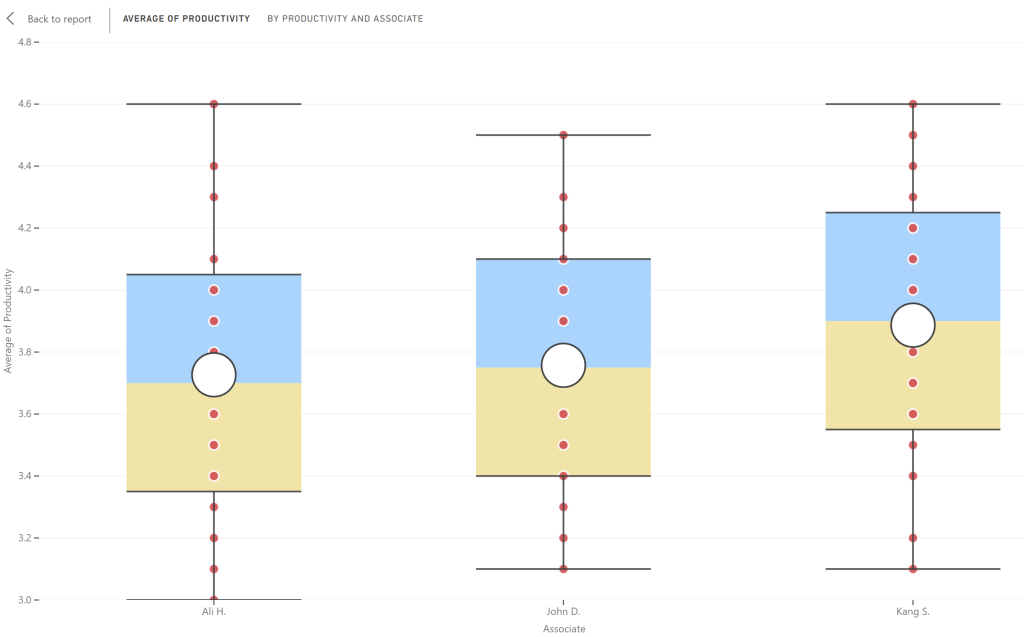
In another instant, we created a boxplot diagram to compare the performance of operator or associates against each other. Boxplots are great visuals not only to compare average performance values, but also to identify variabilities or lack of consistencies. Variabilities contrast consistency. Too much variability hampers our ability to estimate cost of resources in a reliable way. It also has a negative impact on our ability to schedule jobs and deliver on time. By constructing an appropriate boxplot, we were able to identify the best-in-class performers and facilitate sharing of their “secret recipes”, to cross-pollinate knowledge and skills, and elevate overall team productivity.
Productivity Trend by Project
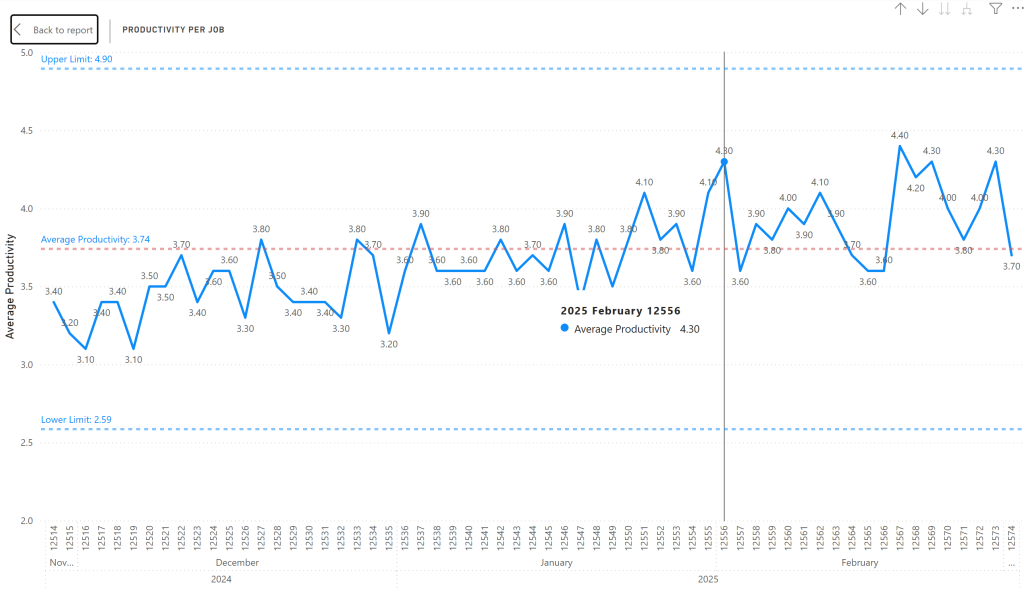
Productivity can also be analyzed at job or project level. Why some jobs score high while the others not so much? What are some of the characteristics of high-performing jobs? Can we bring in more of them? Identifying high
contributing jobs or projects, and looking under their hood, shed light on some of the commonalities of high performing jobs. The same is true for challenged jobs or projects. We want to identify the common causes of low performance and work toward removing them. We may also find ways to specify the next incoming jobs more cleverly to prevent issues from occurring down the road. A lot have been learned to do more of the good and less of the bad.
Key Takeaways
- Monitoring the right productivity measures pay.
- We found a ton of unexplored and unexploited free knowledge in every client-organization we worked for.
- Illustrative visuals set the stage for continuous improvement. People like to see the numbers get better and that drives their action.
- Other ways to explore and monitor productivity
- By customer
- By market region
- By shift
- By plant
- By time of the day
- …..
- Let’s Explore!